Yearly Archives: 2011

The Eurosystem: Part 1

The Eurosystem consists of the European Central Bank (ECB) and 17 National Central Banks (NCBs) of the member nations. The purpose of this post (and some that will follow) is to explain how the RTGS payment and settlement system called TARGET2 works in order to understand the flow of funds within the Euro Area. The purpose is also to show that money is endogenous in the Euro Area, that it cannot be otherwise and describe the Euro Area economic dynamics in the money endogeneity framework

First consider payments within a nation, i.e., domestic payments. In the Euro Area, it happens exactly in the way as in any nation. I had a post covering this – Payment Systems And Settlement. An example illustrates this:

Suppose a household A holding deposits in Bank A in Spain wishes to make a payment of €100 to an institution B banking at Bank B. The household A will give an instruction to her Bank A to transfer funds to Bank B. Assuming this goes through, the Spanish central bank Banco de Espana will debit Bank A’s account and credit Bank B’s account. Bank B will credit institution B’s account €100. If Bank A has insufficient funds at Banco de Espana, the latter will provide the former intraday credit free of charge.

So transactions such as the above give rise to payment flows in all directions. To understand how the Eurosystem handles this, it is useful to go into some rules.

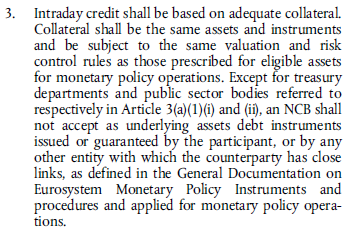
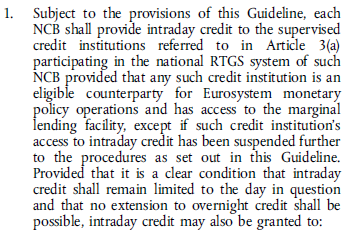
The Guideline of European Central Bank of 30 December 2005 on a Trans-European Automated Real-time Gross settlement Express Transfer system (TARGET) (ECB/2005/16) 3(f) 1 says (link)

and 3(f)3 says

and finally 3(f)5 says

So within the day banks can go into overdraft at the home central bank by pledging collateral. In practice, banks have more collateral at the central bank to cover for daily fluctuations. Also, in the Euro Area, banks need to satisfy a reserve requirement of 2% which means that the amount of reserves deposited at the NCB should be at least 2% of the deposit liabilities. How do banks get the reserves when they lose reserves? During the day, the intraday credit itself provide the reserves. (Loans make deposits!). However toward the end of the day, banks may want to instead borrow from the rest of the financial system, instead of relying on central bank credit because the latter is free of interest only intraday and is charged an interest rate equal to that of the marginal lending facility overnight. Typically, this poses no problem because some banks may have excess reserves which they may want to lend out because keeping it deposited at the central bank will pay an interest equal to that of the deposit facility which is lower. So typically, banks would retire intraday credit toward the end of the day and borrow funds from the rest of the financial system.

An exception to the above arises during periods of market stress or crisis, when banks prefer to not lend the excess funds due to credit risks and are happy to keep funds deposited at the central bank despite earning lower interest.

As banks create more money by lending (more credit to be precise), the reserve requirement of the whole banking system would increase. How do banks in the Euro Area get more reserves?

It is useful here to distinguish between two types of monetary systems – overdraft and asset-based. In the former, banks as a whole get all the reserves directly by borrowing from the central bank (provided they pledge good collateral) and in the latter, the central bank would create reserves required by the banking system by engaging in permanent open market operations or outright operations, typically purchasing government bonds. The Euro Area monetary system is best described by the former and Anglo-Saxon monetary systems such as one in the United States is best described by latter. Even in the latter, the Federal Reserve does provide direct credit to banks but these are retired quickly. The distinction can be made by looking at the balance sheet of the central bank.

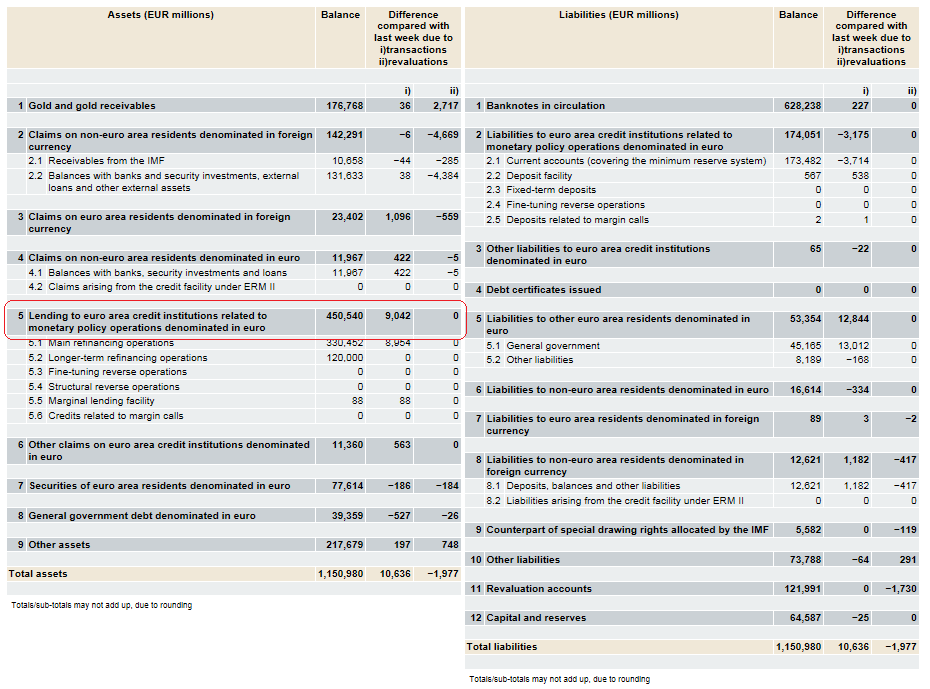
We are yet to see the Eurosystem being described as a whole, but for our purpose of clarifying how an overdraft system looks, it is sufficient to just take a glance at the consolidated balance sheet to verify. The Eurosystem balance sheet near the end of 2006 looked like this (link):

(click to enlarge)

The item rounded in red is €450, 540 million which is a big proportion of the total size of the balance sheet, and one doesn’t see this for the Federal Reserve (in normal circumstances).

Since the Eurosystem is an overdraft type, the funds obtained have to be provided by direct lending by the Eurosystem. This is done mainly via two types of operations – Main Refinancing Operations (MROs), and Long Term Refinancing Operations (LTROs), where the Eurosystem conducts an auction to lend the whole banking system. For the former, the auctions are held weekly and the lending is for one week. LTROs, it is typically conducted every month and the duration of refinancing is three months. As the names suggest, MROs are used mostly.

This will conclude my post. The posts following this will look at cross-border flows of funds and government accounts. They (either one post or two) will attempt to provide the reader an idea of how cross-border dynamics are important for the Euro Area.

Update: Corrected the discussion on frequency and duration of LTROs in the second last para.
Financial Crisis And Flow Of Funds

Marc Lavoie forwarded me the European Central Bank’s Monthly Bulletin, October 2011 which has a section on TARGET2 and the European monetary system. I have had good discussions with him on emails to nail the TARGET2 operations so it is good to see the conclusions being verified in publications. I am waiting to write a long blog post on TARGET2 and trying to collect sources I can quote/link and I came across a section on flow of funds in the same article. It appears on page 99 (page 100 of the pdf) and is titled The Financial Crisis In The Light Of Euro Area Accounts: A Flow-Of-Funds Perspective. 

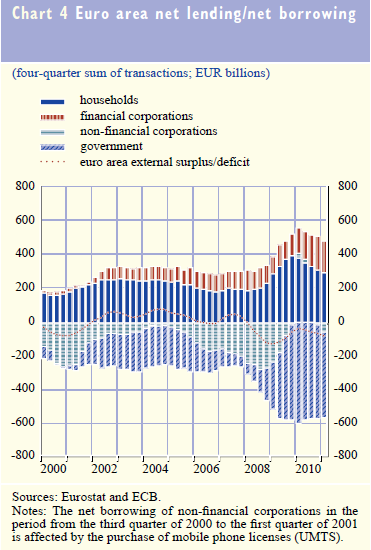
The article has this chart which will be very familiar to readers because it has been in the Levy Institute’s Strategic Prospects since many years.

There are some differences in terminologies. Wynne Godley (and Francis Cripps) started using NAFA (Net Accumulation/Acquisition of Financial Assets) to denote a sector’s surplus in the 1970s and Levy Institute has continued using this. Modern national accountants use Net Lending (by a sector) and split this into Net Acquisition of Financial Assets and Net Incurrence/Acquisition/Increase of/of/in Liabilities and take the difference. Levy’s authors also use Net Lending but as Net Lending to a Sector – e.g., Net Lending to Households.

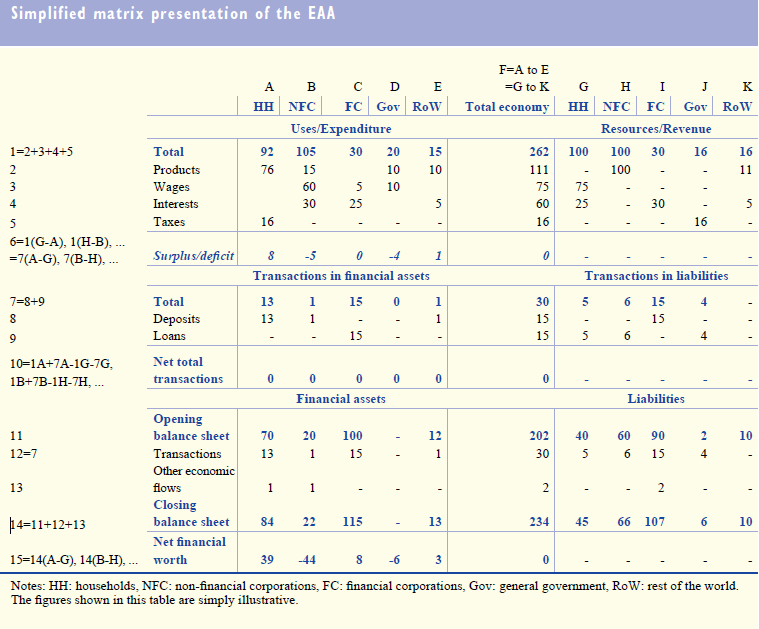
The article also presents this table (termed Transactions Flow Matrix by Wynne Godley – his greatest trick)

(click to enlarge)

and has this description:

The sectoral accounts present the accounts of institutional sectors in a coherent and integrated way, linking – similar to the way in which profit and loss, cash flows and balance sheet statements are linked in business accounting  – uses/expenditure, resources/revenue, financial flows and their accumulation into balance sheets from one period to the next.To this effect, all units in the economy are classified in one of the four institutional sectors (i.e. households, non-financial corporations, financial corporations and general government). Their accounts are presented using identical classifications and accounting rules (those of ESA 95), in a manner such that each transaction/asset reported by one unit will be symmetrically reported by the counterpart unit (at least in principle). Accordingly, the sectoral accounts present the data with three constraints: each sector must be in balance vertically (e.g. the excess of expenditure on revenue must be equal to financing); all sectors must add up horizontally (e.g. all wages paid by sectors must be earned by households); and transactions in assets/liabilities plus holding gains/losses and other changes in the volume of assets/liabilities must be consistent with changes in balance sheets (stock-flow consistency). The sectoral accounts are commonly presented in a matrix form, with sectors in columns and transactions/instruments in rows, with horizontal and vertical totals adding up (see the example in the table).

The first five rows of the table show the expenditure and revenues of each of the sectors (broken down into types of expenditure/revenue). In row 6, the difference between revenue and expenditure (the surplus/deficit) is shown.

The notions of revenue and expenditure are close to, but generally less encompassing than, the more traditional national account concepts of resources and uses. Income can then be defined as revenue (except capital transfers received) minus expenditure other than final consumption and capital expenditure (capital formation and capital transfers paid). For corporations, income corresponds to retained earnings. Savings is the excess of income over final consumption.

Surpluses/deficits are then associated with transactions in financial assets and liabilities in each sector. This is shown in rows 7 to 10. The bottom part of the table shows the stocks of assets and liabilities, which result from the accumulation of transactions and other flows. This table is extremely simplified (e.g. omitting an explicit presentation of the stock of non-financial assets).

The excess of revenue over expenditure is the net lending/net borrowing (i.e. financial surplus/ deficit), a key indicator of the sectoral accounts. Typically, a household’s revenue will exceed its expenditure. Households are thus providers of net lending to the rest of the economy. Non-financial corporations typically do not cover their expenditure by revenue, as they finance at least part of their non-financial investments by funds from other sectors in addition to internal funds. Non-financial corporations are thus typically net borrowers. Governments are also often net borrowers. If the net lending provided by households is not sufficient to cover the net borrowing of the other sectors, the economy as a whole has a net borrowing position vis-à-vis the rest of the world. Deviations from this typical constellation were apparent in several euro area countries before the crisis, in particular, with extremely elevated residential investment that resulted in households becoming net borrowers (as has been the case in the United States).

The adding-up constraints in the accounts require that any (ex ante) increase in the financial balance of one sector is matched by a reduction in the financial balances of other sectors. The accounting framework does not, however, indicate by which mechanism this reduction will be brought about, or which mechanisms are at play. The EAA makes it possible to track changes in net lending in the different sectors of the economy. It also specifies the financial instruments affected and shows how the transactions and valuation changes leave a lasting effect on the balance sheets of the sectors.

The article is worth a read.

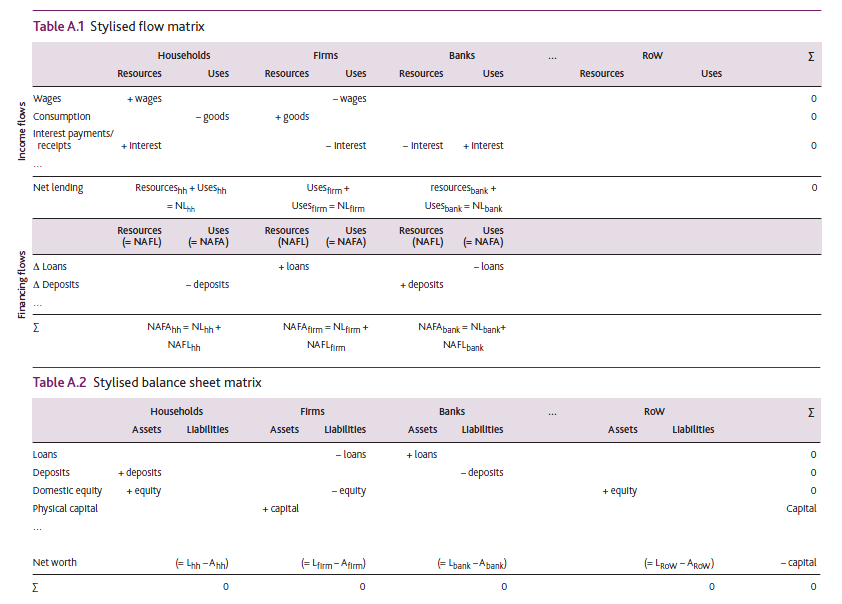
The Bank of England also had a similar article recently but before: Growing Fragilities – Balance Sheets In The Great Moderation by Richard Barwell and Oliver Burrows and quotes the work of G&L (Godley and Lavoie). It also has a similar matrix as the ECB’s article.

(click to enlarge)

Godley and Lavoie build a series of closed accounting frameworks based on the system of National Accounts, which encompass: the standard national income flows, such as wages and consumption; the counterpart financing flows, such as bank loans and deposits; and stocks of physical and financial assets and liabilities. This framework lends itself to representation in a set of matrices. The first matrix captures flow variables (Table A.1). The columns represent the sectors of the economy and the rows represent the markets in which they interact. The matrix has two important properties. Each sector’s resources and uses columns provide their budget constraint — the sums must equal to ensure that all funds they receive are accounted for. And each row must also sum to zero, to ensure that each market clears — that is, the supply of a particular asset must be matched by purchases of that asset, to ensure that no funds go astray.

The table can usefully be split in two, with the top half covering the standard income and expenditure flows and the bottom half covering financing flows. The two halves of the table are linked together by each sector’s ‘net lending balance’, or ‘financial surplus’. The net lending balance can be used to summarise each sector’s income and expenditure flows as the difference between the amount the sector spends on consumption and physical investment and the amount that it receives in income. This difference must be met by financing flows — either borrowing or the sale of financial assets. In national accounts terminology, a sector’s net lending balance (NL) must equal its net acquisition of financial assets (NAFA) less its net acquisition of liabilities (NAFL). Across sectors, the net lending balances have to sum to zero, as all funds borrowed by one sector must ultimately come from another.

While it is useful to split the table for accounting purposes into income and expenditure flows and financing flows, it is important to note that the acquisition of financial assets and liabilities is not necessarily determined purely by imbalances between income and desired expenditure. Sectoral balance sheets can adjust for other reasons. Agents may want to borrow money to purchase assets, simultaneously acquiring financial assets and liabilities. And on occasion agents may want to shrink the size of their balance sheets, selling off financial assets to pay off financial liabilities. Finally, some agents may default on their debt obligations, which will involve a revision in the financial assets and liabilities of both debtor and creditor. At an aggregate level, simultaneous expansion of a sector’s assets and liabilities invariably represents one set of underlying agents taking on assets whilst the other takes on liabilities. The household sector provides an important example. If a young household takes a mortgage to buy a house from an old household, the sector in aggregate simultaneously acquires a liability (the young household’s mortgage) and an asset (the deposit created for the young household to pay to the old household).

All of these activities — leveraging up, deleveraging and default — involve NAFA and NAFL moving in lockstep. The net lending identity still holds: the gap between income and expenditure determines the difference between NAFA and NAFL. But the absolute size of the NAFA and NAFL flows is determined by agents’ actions in financial markets. The second table captures the balance sheet positions of each sector. The balance sheet matrix is updated over time using data on the acquisition of assets and liabilities from the transaction flows matrix, and revaluation effects to asset positions. Proceeding in this manner, balance sheets always balance across sectors, flows of funds are always accounted for over time and the impact of flows of funds on balance sheets is always recorded.

Again, good article!

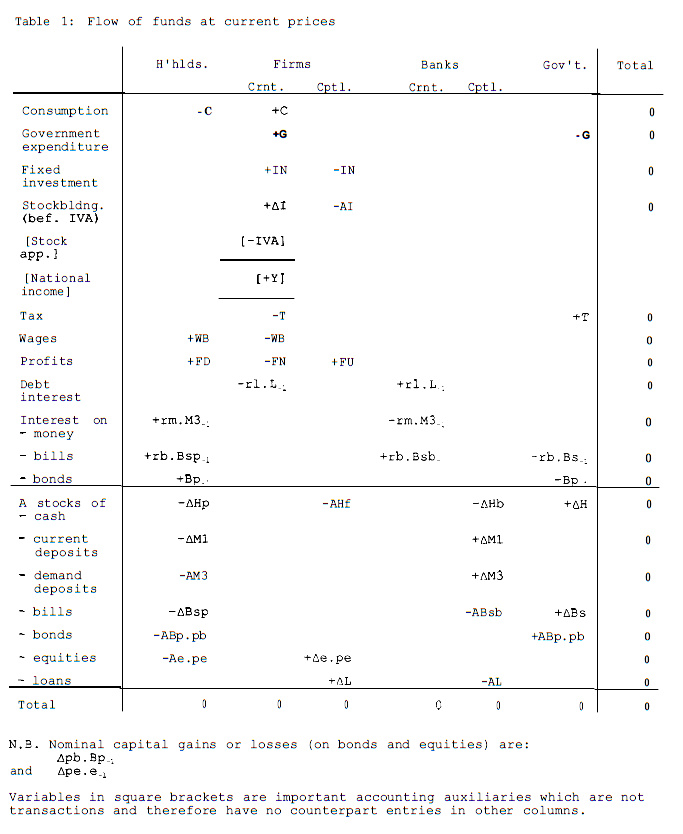
The first time a proper transactions flow matrix appeared was in a 1996 Levy institute paper by Wynne Godley:  Money, Finance And National Income Determination – An Integrated Approach.

(click to enlarge)

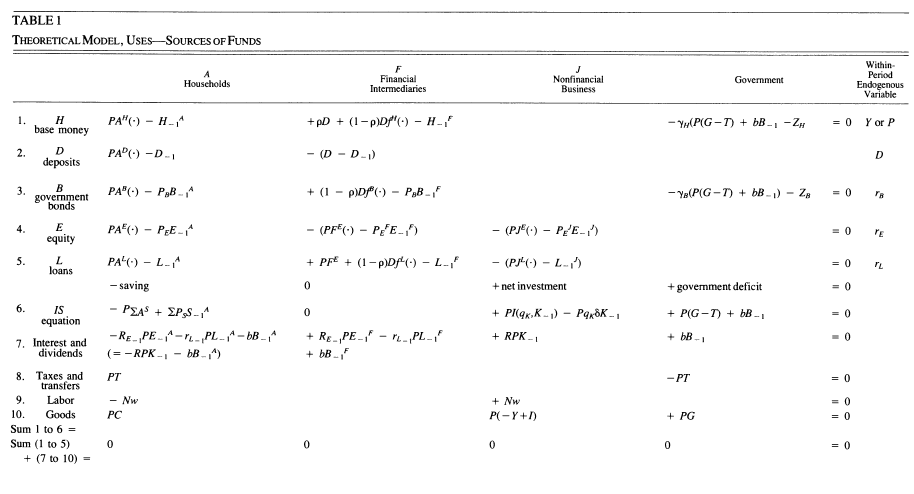
James Tobin et al. had something similar – almost but not quite in A Model Of US Financial And Nonfinancial Economic Behavior :

(click to enlarge)

Hungary Again

I had two previous posts on Hungary here and here. Initially I thought of writing more on this, but today Fitch came out with a rating action and I guess explains most stuff on the deterioration of the economy – so enough of Hungary for now. Find below Fitch’s release. I quoted two comments highlighting CHF mortgages (equivalent of 16% of GDP) while my first post was on deteriorating external finance – both highlighted by Fitch.

Full report below

Fitch Revises Hungary’s Outlook to Negative; Affirms at ‘BBB

Fitch Ratings-London-11 November 2011: Fitch Ratings has revised the Outlooks on the Republic of Hungary’s Long-term foreign and local currency Issuer Default Ratings (IDR) to Negative from Stable and affirmed the ratings at ‘BBB-‘ and ‘BBB’, respectively. The agency has also affirmed Hungary’s Short-term IDR at ‘F3’ and Country Ceiling at ‘A-‘.
“The revision in Hungary’s Outlook to Negative reflects a sharp deterioration in the external growth and financing environment facing Hungary’s small, open and relatively heavily indebted economy,” says Matteo Napolitano, Director in Fitch’s Sovereign Group. “Moreover, various fiscal policy measures and the scheme to allow the repayment of household foreign currency mortgages at below market exchange rates have dented foreign investor confidence, on which medium-term growth prospects depend.”

Hungary is particularly exposed to any deterioration in the economic and financial conditions in the eurozone, owing to its open economy, mainly Western European-owned banking sector, relatively high levels of public and external debt and financing ratios, sizeable stock of portfolio investment (including a 40% non-resident share of domestically issued government debt) and Swiss Franc (CHF) mortgages debt.

Heightened risk aversion has increased refinancing risks on external sovereign maturities. Hungary needs to refinance around EUR4.6bn in 2012, and EUR5bn-EUR5.6bn annually in 2013-14, of foreign exchange denominated debt. Any potential selling of HUF-denominated debt by non-resident investors could add to financing pressures. The government’s EUR1.6bn cash deposit at the central bank provides a moderate buffer against refinancing risks.

Growth prospects have weakened sharply both in Hungary and in its main Western European trading partners in recent months. In October, Fitch revised its forecast for 2012 eurozone GDP growth down to 0.8% from 1.8% previously, and to 1.6% from 1.7% previously for 2011. Against this backdrop, with domestic demand weighed down by fiscal tightening and private-sector de-leveraging, Fitch expects Hungary’s economy to grow by only 0.5% in 2012, down sharply from the agency’s projection of 3.2% in June 2011.

The government appears committed to fiscal consolidation and through the course of 2011, has set out an array of measures in the Szell Kalman plan in March, the Convergence Programme in April and the new measures announced in September. Despite some widening in the structural budget deficit in 2011, it will run a general government surplus in 2011 of around 3.5% of GDP, driven by large one-off factors such as the return of private pension assets to the public sector. Fitch forecasts that government debt will decline to around 76% of GDP at end-2011, from 80% at end-2010.

For 2012, the government intends to reduce the structural budget deficit by over 2 percentage points of GDP to bring the headline deficit to 2.5% of GDP, thus taking Hungary out of the EU’s Excessive Deficit Procedure (EDP). However, the weak growth outlook, the uncertain costing and implementation of some measures and potential reform fatigue make this challenging. Fitch forecasts a 2012 budget deficit of 3.3% of GDP.

Over the course of 2011 the Hungarian forint (HUF) has depreciated by 13%-14% against both the euro and the CHF, thus increasing further heavy public- and private-sector debt repayment burdens. The government’s policies to tackle the large stock of CHF-denominated household debt (equivalent to 16% of GDP in mid-2011) may turn out to be fairly ineffective and have negative consequences. Credit constraints and a lack of sufficient savings will likely prevent the share of CHF loans that are repaid early at a preferential exchange rate from rising above 20%-25% of the total (see ‘Hungary: Risks from Swiss Franc Debt Exposure’, dated 5 October 2011 at www.fitchratings.com).

However, this will still place further pressure on the HUF and on the banking sector’s balance sheet, which is already beset by an exceptional levy, rising non-performing loans and several years of sluggish economic activity. Although the system average Tier 1 capital adequacy ratio (CAR), at 10.9% in September 2011, looks reasonable, a number of banks are already making losses and will require re-capitalisation – which is likely to be forthcoming from foreign parents. Nevertheless, foreign parent banks are likely to continue to cut their exposure to Hungary and the supply of credit is likely to continue to contract, weighing on GDP growth.

Some of Hungary’s fundamental rating strengths such as a rich and diverse economy, and underlying political stability remain in place. Moreover, it is running a large current account surplus, which Fitch forecasts at an annual average of 2.4% in 2011-12, helped by resilient export performance and weak domestic demand. It should also attract around USD2bn in non-debt financing in 2012 from EU transfers and other sources.

Foreign direct investment (FDI) registered a net outflow of EUR1bn in H111. Aside from a handful of large investments in the automotive sector, there are few significant FDI projects in the pipeline. Potential investors appear to be either delaying decisions, or investing elsewhere, as government policies have eroded Hungary’s business climate – a traditional rating strength and key part of the growth model.

When Fitch affirmed Hungary’s rating at ‘BBB-‘ and revised the Outlook to Stable on 6 June 2011, it noted that “negative pressure on the rating could also emerge from the anaemic growth, private sector capital outflows, increased problems in the banking sector or a significant shift in investor sentiment that adversely affected Hungary’s public and external financing capacity”.

Hungary is exposed to an intensification of financial instability and recession in the euro area. A significantly worse than currently anticipated slowdown, evidence of private sector capital outflows or problems in the banking sector, a rise in the risk premium or fiscal financing pressure could lead to a downgrade. A material weakening in the government’s commitment to fiscal consolidation could also lead to a downgrade.

Conversely, the government meeting its budget deficit targets and a return to healthy growth, particularly in the context of significant structural reforms and declining external debt ratios, could lead to positive rating action.

Contact:

Primary Analyst
Matteo Napolitano
Director
+44 20 3530 1189
Fitch Ratings Limited
30 North Colonnade
London, E14 5GN

Secondary Analyst
Ed Parker
Managing Director
+44 20 3530 1176

Committee Chairperson
Shelly Shetty
Senior Director
+1 212-908-0324

Media Relations: Peter Fitzpatrick, London, Tel: +44 20 3530 1103, Email: peter.fitzpatrick@fitchratings.com.

Additional information is available at www.fitchratings.com.

The ratings above were solicited by, or on behalf of, the issuer, and therefore, Fitch has been compensated for the provision of the ratings.

Applicable criteria, ‘Sovereign Rating Methodology’, dated 15 August 2011, are available at www.fitchratings.com.

Applicable Criteria and Related Research:
Sovereign Rating Methodology

ALL FITCH CREDIT RATINGS ARE SUBJECT TO CERTAIN LIMITATIONS AND DISCLAIMERS. PLEASE READ THESE LIMITATIONS AND DISCLAIMERS BY FOLLOWING THIS LINK: HTTP://FITCHRATINGS.COM/UNDERSTANDINGCREDITRATINGS. IN ADDITION, RATING DEFINITIONS AND THE TERMS OF USE OF SUCH RATINGS ARE AVAILABLE ON THE AGENCY’S PUBLIC WEBSITE ‘WWW.FITCHRATINGS.COM’. PUBLISHED RATINGS, CRITERIA AND METHODOLOGIES ARE AVAILABLE FROM THIS SITE AT ALL TIMES. FITCH’S CODE OF CONDUCT, CONFIDENTIALITY, CONFLICTS OF INTEREST, AFFILIATE FIREWALL, COMPLIANCE AND OTHER RELEVANT POLICIES AND PROCEDURES ARE ALSO AVAILABLE FROM THE ‘CODE OF CONDUCT’ SECTION OF THIS SITE.

Copyright © 2011 by Fitch, Inc., Fitch Ratings Ltd. and its subsidiaries.

Holders Of Italy’s Public Debt And Government Securities

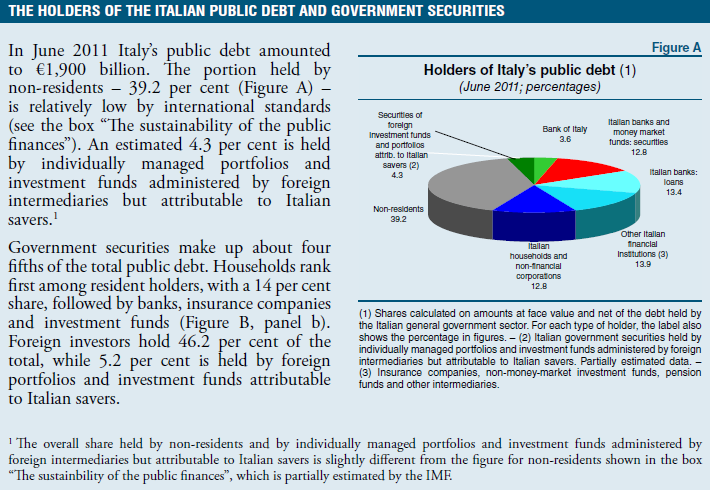
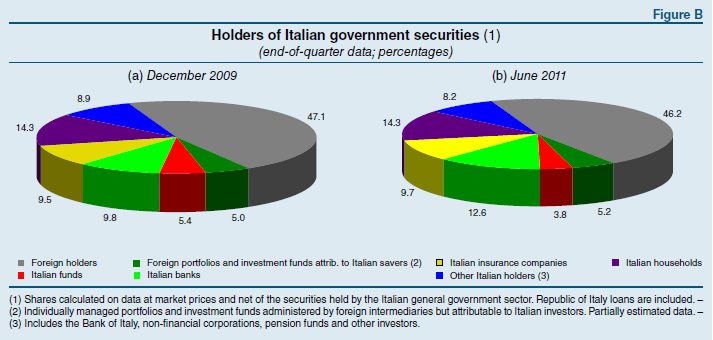
Banca d’Italia – Italy’s National Central Bank – released its Financial Stability Report, Nov 2011 recently. With movements in Italian government bond yields making headlines, the following graphs from the report might be useful.

(Click to enlarge)

Lots of foreigners = lots of trouble!

Comments On Post On Hungary

I received two comments in my previous posts on Hungary. I have a 0-comments policy (as opposed to no-comments policy) because maintaining comments is additional responsibility 🙂 and am posting them here. I received few more comments on other posts so apologies for being partial to some comments in over others.

Sergei said:

It is a very one-side story. I am not even sure it connects any dots. The problem in Hungary is CHF mortgages and with the CHF action it is easy to imagine how many of those are seriously underwater. Even worth, some months ago the government legislated a law which allowed a certain type of mortgage borrowers to prepay their CHF mortgages at, I think, 180 CHFHUF while the current rate is almost north of 250. And these transactions have to be executed by Christmas.

CHF mortgages were typically structured as foreign currency clause, i.e. they are denominated in CHF but all payments are made in HUF at spot. While the mortgage market was booming, Hungarian central bank accumulated huge fx reserves coming from CHF which it was buying from banks which financed from their western parents their local CHF mortgage portfolios. Now, as these flows reverse and as government puts deliberate pressure to reverse them, and as central bank in all its stupidly refuses to sell back its fx-reserves, HUF obviously depreciates.

So the current account story might be a correct introduction but the real reason of depreciation, I believe, is much deeper.

BFG said:

Nice blog Ramanan,

The forint was pegged to the euro until Feb 2008, notice the large turn around in the current account when they abandoned the peg, with the hugh depreciation in their currency. They also have a big mortgage problem in which two-thirds of Hungarian mortgages are denominated in Swiss francs. They receive their income in forints and sell it to pay their mortgages in francs reinforcing the upward spiral against the Swiss franc. Even, if they accept the euro which is very unlikely they will still have the franc problem.

Thanks for the comments.

My post was based on just half an hour of research, but anyhow the point I am making is that Hungary’s balance of payments position makes it very difficult for fiscal policy to do the rescue. (Plus unnecessary pressure from Olli Rehn makes it even harder!)

It doesn’t matter if HUF was pegged to the Euro, going forward. Also, the size of the public debt and the net foreign asset positions makes it clear that the Hungarian private sector is heavily in debt and in fact has a net financial liability position. The fact that the mortgages are indexed (or directly denominated in CHF) makes it even worse as far as debt burden of Hungarian households is concerned. Maybe, this calls for a separate post on this.

However, one should be careful if the interest payments are to be included in the balance of payments or not. If the lender is a domestic bank, it is not included. Given the record of the current account deficit of Hungary over so many years, it is difficult to believe that there will be a huge reversal while keeping domestic demand high.

To clarify, my post was on how the balance of payments situation in Hungary is and what implications it has on fiscal policy going forward, and not on factors that led to the implosion of  demand. The fact that mortgages are in CHF (or indexed) makes it even worse!

Hungary?

WSJ’s Marketbeat reports of troubles Hungary may be headed into. The blog post reports:

Hungary this morning had its own T-bill auction, just like Italy. It did not go so well!

Hungary’s auction had a bid-to-cover ratio of just 1.0, and it had to pay a 6.79% yield to move the debt.

I decided to do some basic analysis of what is going on. The Annual Report On Exchange Arrangements And Exchange Restrictions 2010 reports that

and also that:

FT provides the chart of EURHUF:

The depreciation got me even more curious. More screenshots from data sources below. The first one is Hungary’s current account balance as a percentage of GDP, courtesy IMF’s World Economic Outlook, Sep 2011.

(Click to enlarge)

So Hungary has been running a huge current account deficits since many years. A current account deficit means that a nation’s expenditure is higher than income and the difference has to be financed by net borrowing from abroad. During boom times, this may not be problematic but the accumulated debt has to be rolled by attracting foreigners by hook or crook. The route most chosen to prevent getting things out of control is be deflating demand. Only in a Mundell-Fleming fantasy world does the nation’s currency depreciate to bring the current balance of payments to zero and an equilibrium with respect to the external world.

Hungary is a small nation with GDP equivalent of €97b (in 2010, using an approximate average 2010 exchange rate of HUFEUR=0.0036. Note to self: This needs more correction). Due to deficits in the international current balance of payments, the nation has accumulated a debt equivalent of €113.59b (the negative of NIIP) according to the the release Hungary’s balance of payments: 2011 Q2 from Magyar Nemzeti Bank – Hungary’s central bank. With net foreign asset position worse than -100% of GDP, this puts Hungary’s economy in a terrible position. Recent data suggests an improvement in external trade but the international currency markets are not impressed.

According to this Wikipedia Map, Hungary is obliged to join the Eurozone, and has no opt-out option like UK. However, it has not satisfied the Maastricht criteria, and hence the Eurozone won’t let it in yet. Better not! As long as Hungary has its own currency, its government can make a draft at the central bank to finance a portion of its deficit and gives it a tool to protect itself in the short term. So Hungary is protected from being Greece as long as it is not in the Eurozone. But in the long run, Hungary’s growth will be constrained by its balance of payments.

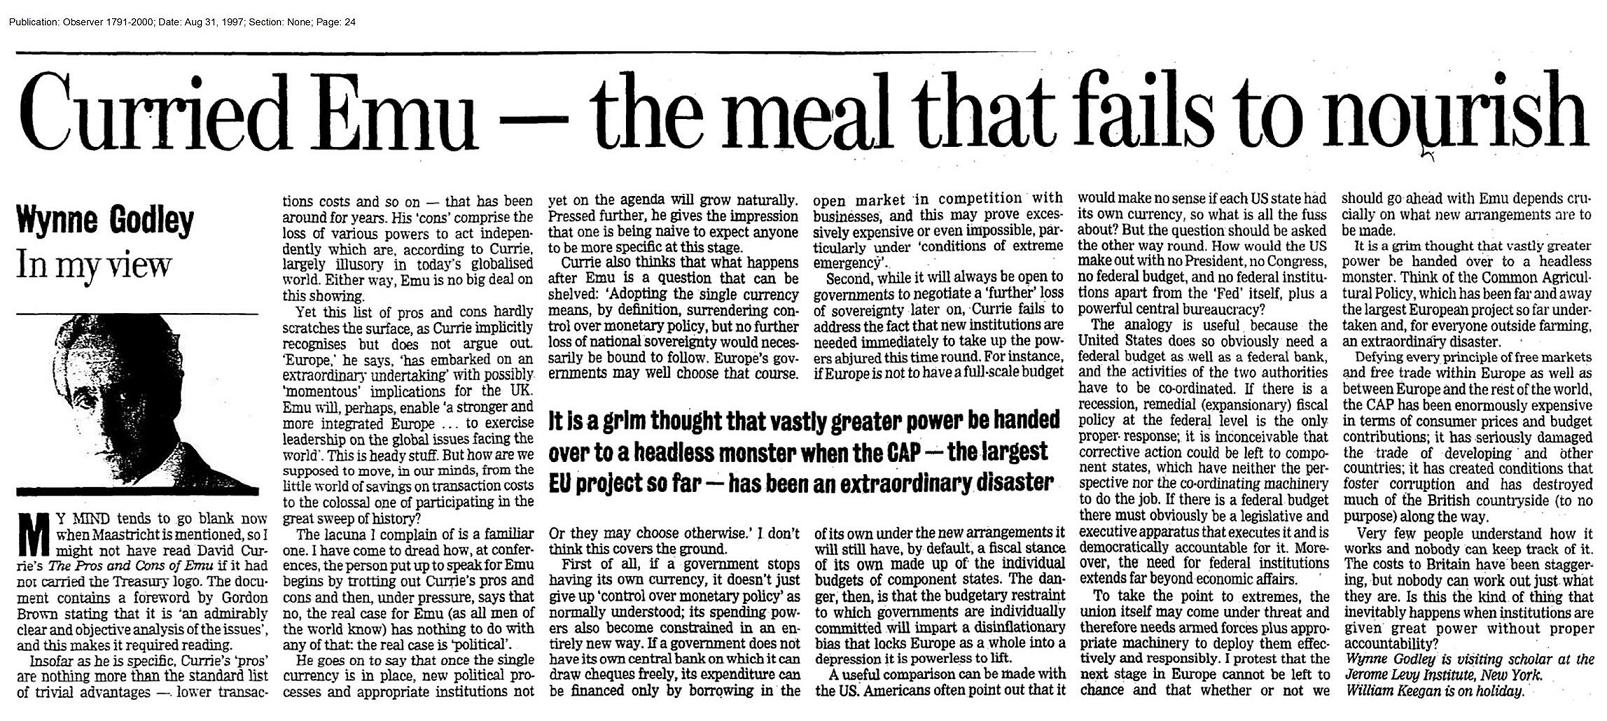
Curried EMU: Wynne Godley From 1997

(Click the newspaper clip to enlarge)

… Currie also thinks what happens after Emu is a question that can be shelved: ‘Adopting the single currency means, by definition, surrendering control over monetary policy, but no further loss of national sovereignty would necessarily be bound to follow. Europe’s governments may well choose that course. Or they may choose otherwise.’ I don’t think this covers the ground.

First of all, if a government stops having its own currency, it doesn’t give up just ‘control over monetary policy’ as normally understood; its spending powers also become constrained in an entirely new way. If a government does not have its own central bank on which it can draw checks freely, its expenditure can be financed only by borrowing in the open market in competition with business firms, and this may prove excessively expensive or even impossible, particularly under ‘conditions of extreme emergency’.

Martin Wolf At His Best!

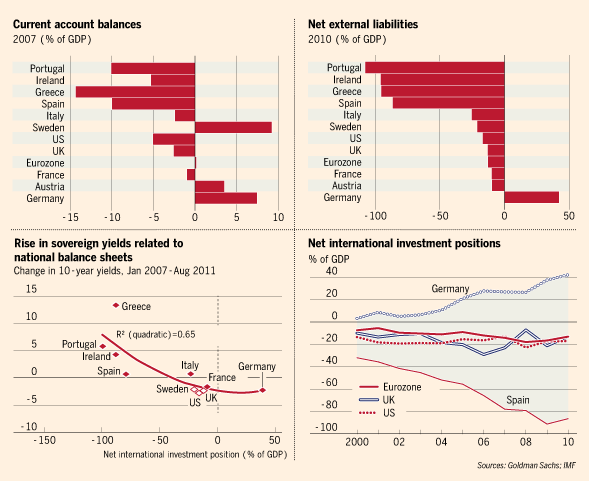
The latest article from Martin Wolf, titled Creditors can huff but they need debtors is probably his best. Martin Wolf correctly identifies the problems with world imbalances:

Blessed are the creditors, for they shall inherit the earth. This is not in the Sermon on the Mount. Yet creditors believe it: if everybody were a creditor, we would have no unpaid debts and financial crises. That, creditors believe, is the way to behave. They are mistaken. Since the world cannot trade with Mars, creditors are joined at the hip to the debtors. The former must accumulate claims on the latter. This puts them in a trap of their own making.

Also, as usual, he has the best charts. You can read the rest here.