In an article, The Profits’ Conundrum, Marshall Auerback uses Kalecki’s profit equation analysis (which is just a simple rearrangement of terms of the sectoral balances equation) to claim that corporate profits have been overstated in the United States.
Now consider the US deficit and explain how on earth we can still have profits as a record percentage of GDP. There is no way that we can have had a fall in the fiscal deficit to GDP ratio from ten percent to three percent (we are in the middle of fiscal yr 2014 remember) without some kind of significant decline in the profit share of GDP.
But NIPA says there is no such fall. All the people who use this sectoral balance analysis keep saying that the profit decline is coming which of course is nonsense. If it is to be it is here and now; we are dealing with an identity. This cannot be ignored, but it is by virtually every single Wall Street analyst.
This does pose the real possibility that we have a massive overstatement of profits.
While it is possible this is the case, I don’t see how this follows from the usage of Kalecki’s profit equation or the sectoral balances equation without any dynamical analysis thrown in.
While the government deficit has fallen, the household sector saving has fallen too and there has been a big rise in firms’ investment expenditure in recent times. So let us look at the data but before that derive the profit equation.
From sectoral balances we know that net lending (in the language of the U.S. Z.1 Flow of Funds report) of all sectors should add to zero.
Firms’ undistributed profits FU is the sector’s saving. So firms’ net lending is:
FU − If
where If is firms’ investment expenditure.
This should be the sum of net borrowing of all the other sectors – households, government and the rest of the world: Household net borrowing + Government net borrowing + Rest of the World net borrowing
Or, in the more usual language,
FU = If + Government deficit − Household Net Lending + CAB
where CAB is the current account balance of international payments.
Each term is a flow and has a time subscript such as −1 or 0 or 1 but I will avoid it. Now let’s compare 2013 and 2009.
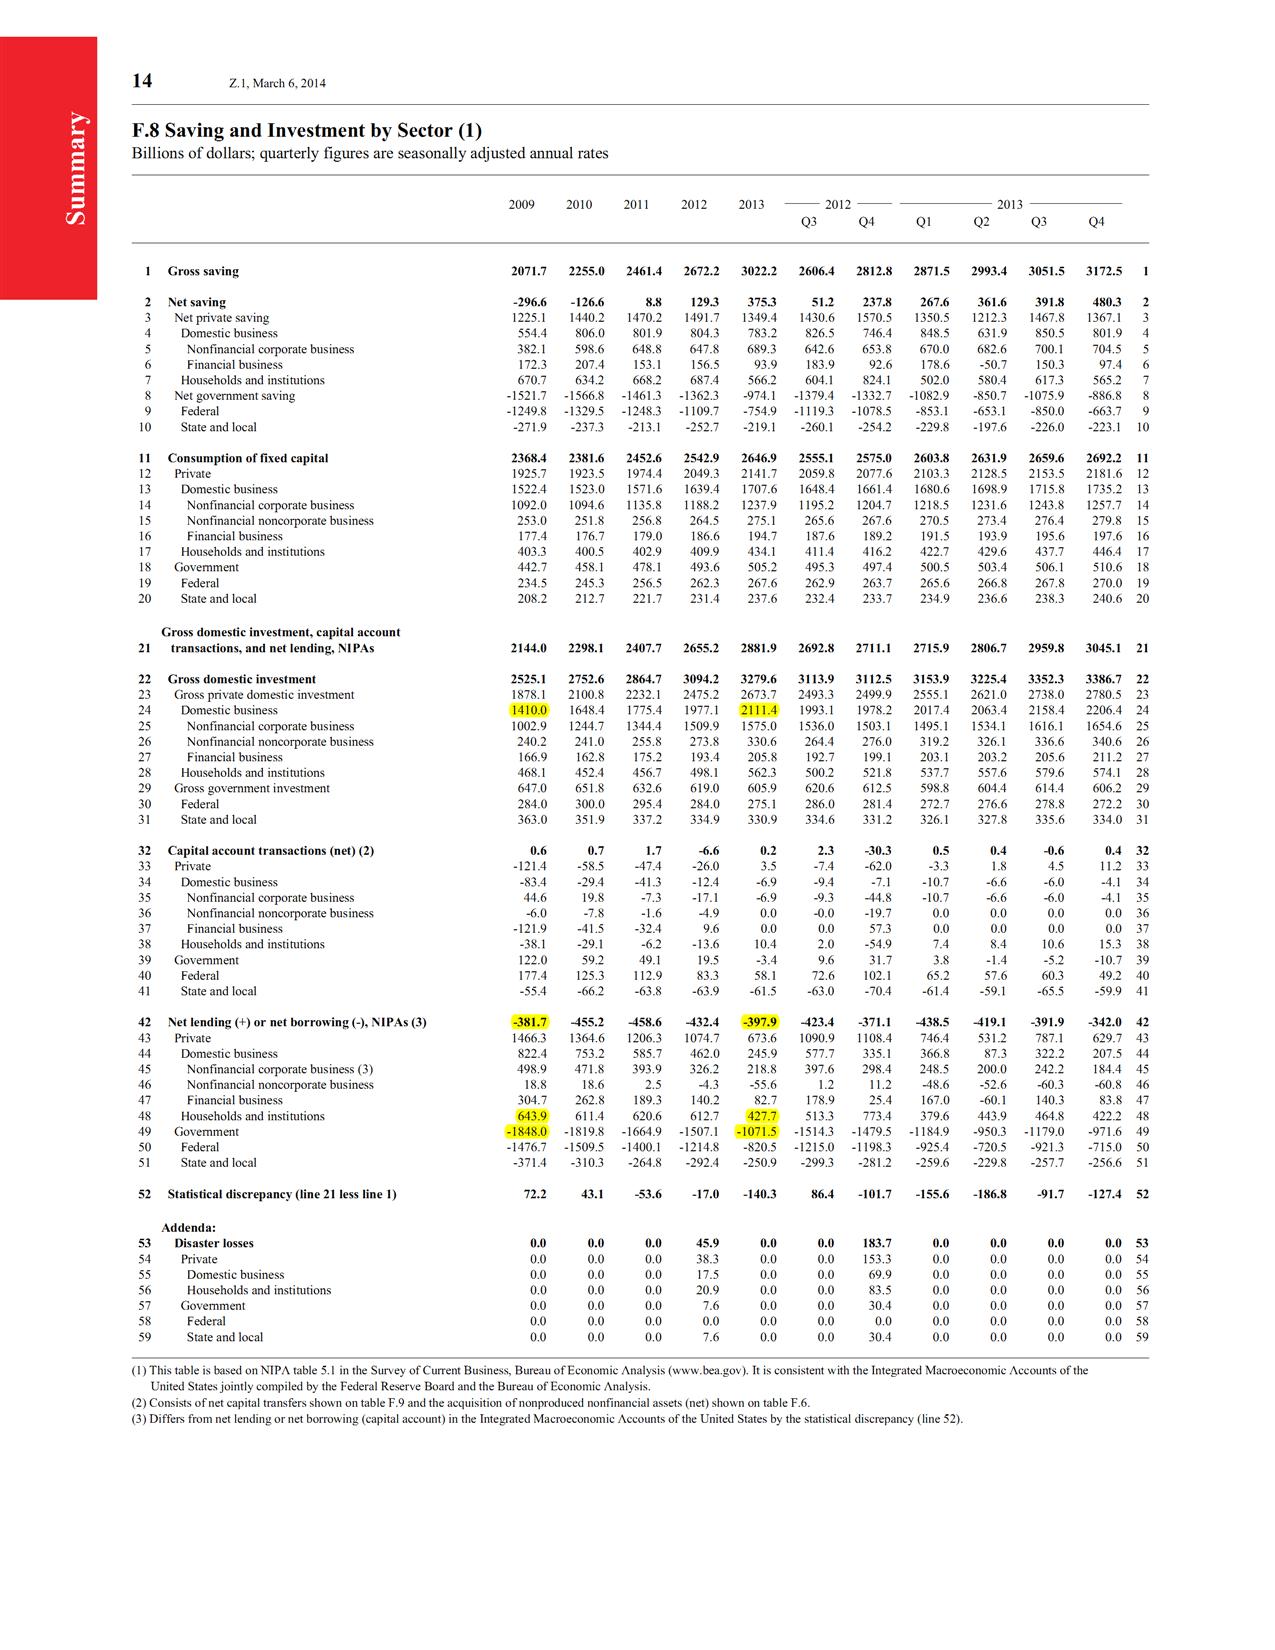
We need the numbers highlighted in yellow to check what’s going on from the Fed’s Z.1 report:
(click to expand and see clearly)
Government deficit is the negative of net lending and between 2009 and 2013 this has reduced by $776.5bn. However, private investment has increased by $704.4bn and household net lending fell by $216.2bn. The change in current account balance over the period is small (line 42). So the rise in private investment and the fall in household net lending (and change in the current account balance) more than offsets the fall in the government deficit.
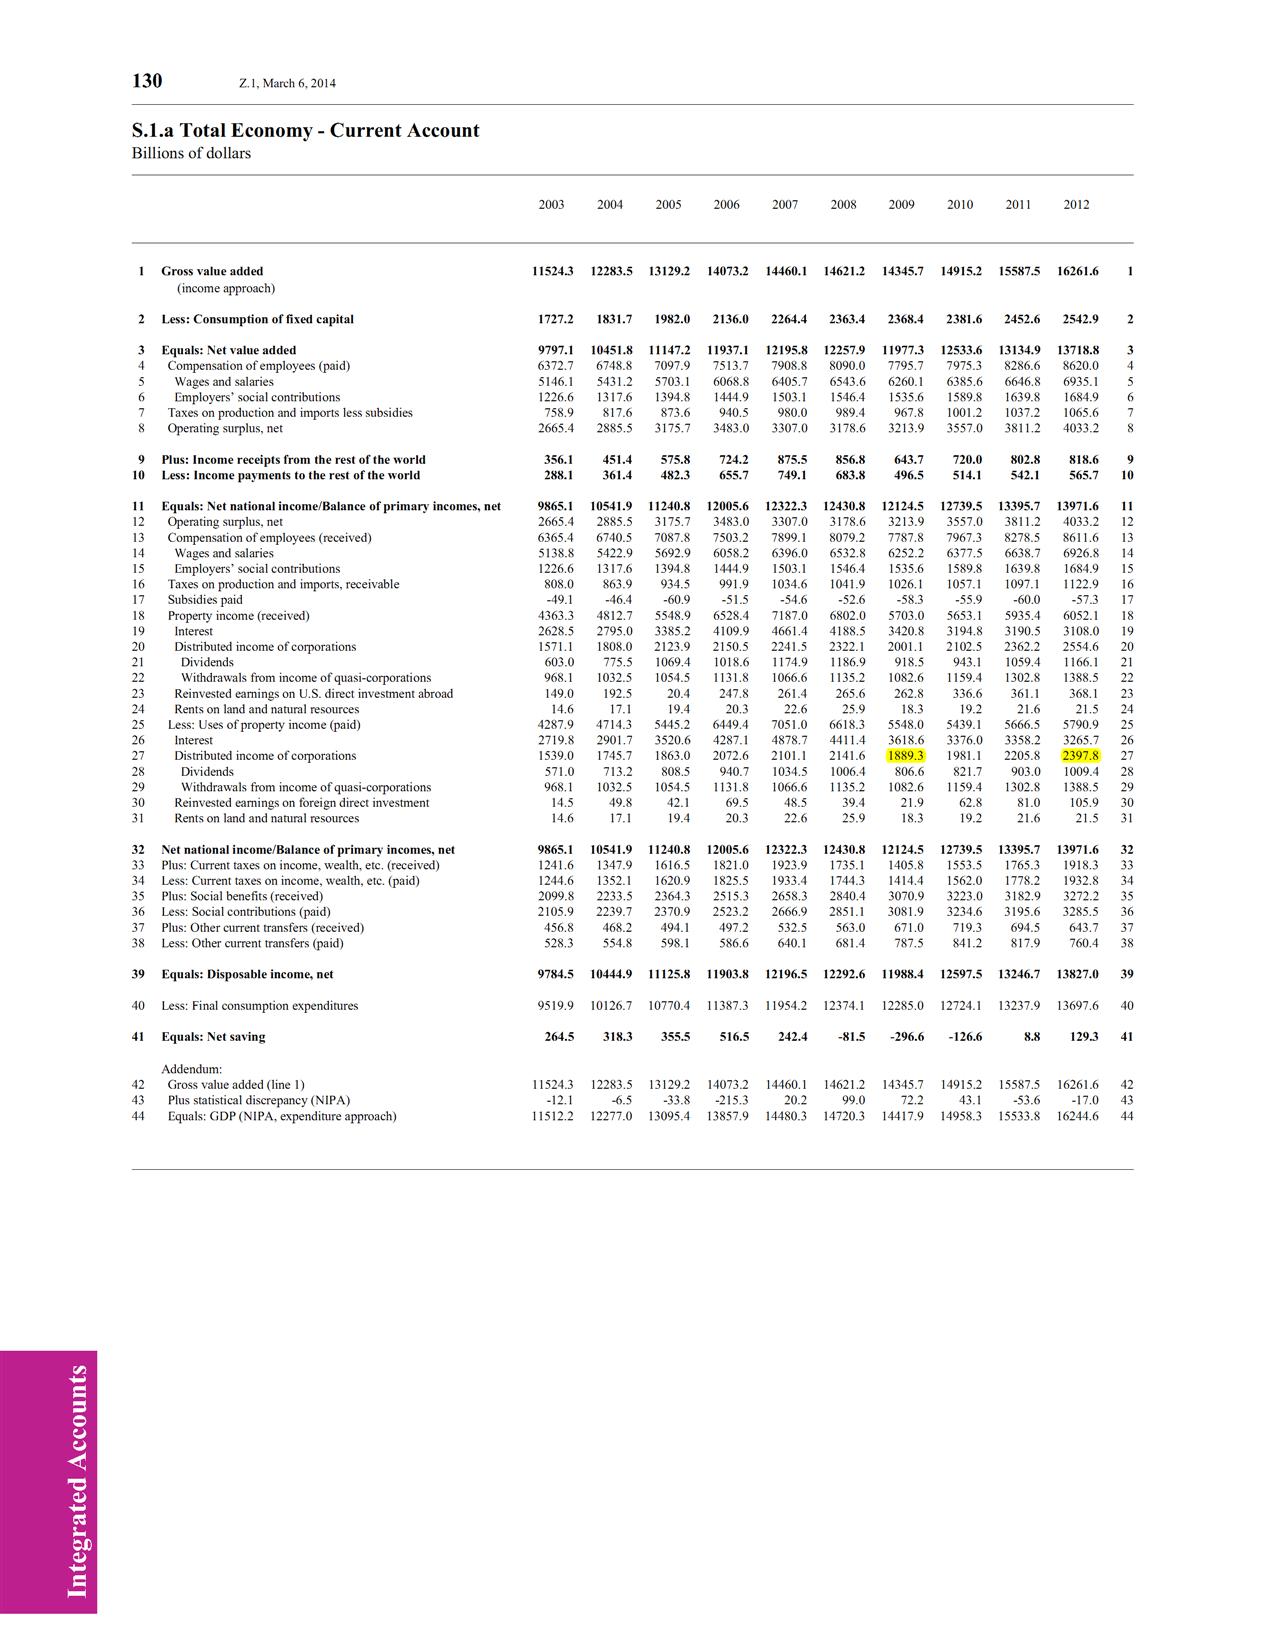
Also remember, reported profits is the sum of undistributed profits and distributed income of corporations. Table S.1.a has data only till 2012 but it shouldn’t be difficult to get a feel for the numbers.
(click to expand)
So the change in distributed income also has been high.
And add complications of taxes to the numbers (pre-tax vs. post-tax), the difference in profits in the last few years is even higher.
Why this exercise if you can get the profits numbers directly? To show that things do add up except for small discrepancies which are always present.
So pure rearrangements of terms of sectoral balance identity doesn’t prove the overstatement of profits as claimed by Auerback. Of course it still leaves the possibility of dynamics which lead to a contraction of aggregate demand and hence profits but Auerback’s claim is that this is purely due to accounting identities and this claim is erroneous.

