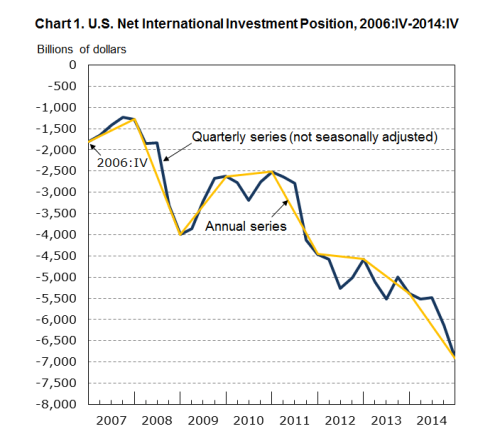
The U.S. Department of Commerce’s Bureau of Economic Analysis today released accounts for the United States’ international investment position. The U.S. is sometimes called the world’s biggest debtor and its net international investment position is now (at the end of 2014) minus $6.9 trillion.
Here’s the chart from the BEA’s website. 
See Wynne Godley’s article The United States And Her Creditors: Can The Symbiosis Last? from 2005 here arguing such things.
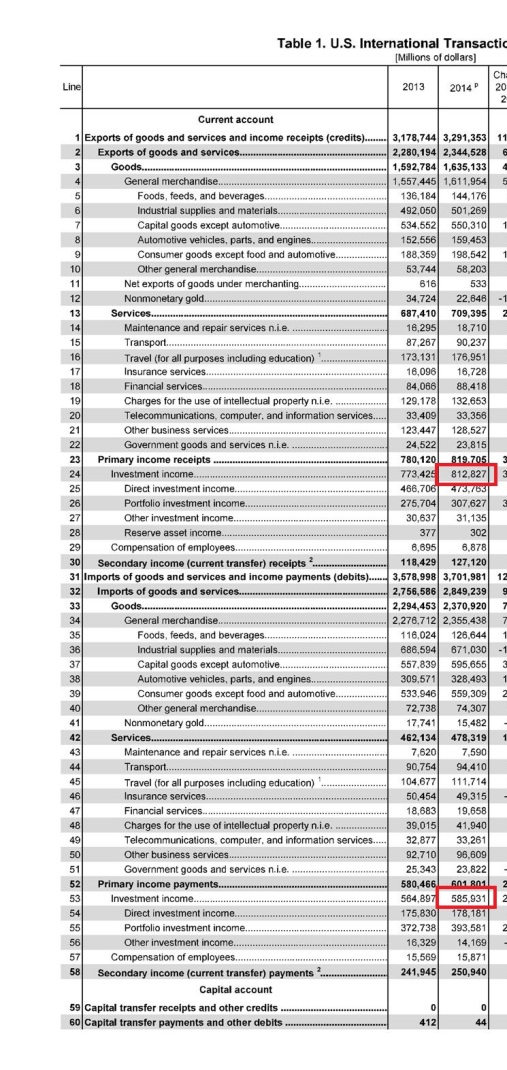
Back to the international investment position. There are a lot of interesting things about it. Although the U.S. in a huge debtor to the rest of the world, the return on assets held by resident economic units of the United States earn more than paying on liabilities to nonresidents. So according to the BEA release U.S. International transactions 2014, investment income in the full year was about $813 billion while income payments was about $586 billion. (More complication arises from “secondary income”).
In addition, revaluations of assets and liabilities also affect the international investment position and revaluations of direct investment held abroad has acted in the United States’ favour.
Of course this cannot always be the case. Take a simple example: Suppose an economic unit’s assets is $100 and liabilities is $150 and suppose assets earn 8% every year and interest paid on liabilities is 5%. So even though the economic unit has a net indebtedness of $50, it is earning
$100 × 8% − $150 × 5% = $0.5
However, if liabilities rise to $160 and beyond the net return turns negative.
In a similar way, there is a tipping point, beyond which the net primary income of the current account of balance of payments turns negative. Because the United States has a negative current account balance and the deficit adds to the net indebtedness every year, at some point in the future, the international investment position may reach a tipping point.
All this sounds as if domestic demand and output are unrelated. This is of course not the case. Imports depend on domestic demand and exports depend on economic activity abroad. Hence the constraint on output at home because if output were to rise fast, the net indebtedness of the United States will also rise fast.
Of course the concept of a tipping point may itself be misleading. Indebtedness can keep rising even if net primary income turns negative without any trouble in financial markets because it all depends on how the financial markets see the problem. But it may be said that once a tipping point is reached, the debt will start to rise much faster than now. My article here hasn’t gone into any analysis here with numbers but I will leave it for another day.