The latest Strategic Analysis report from Levy Institute.
Interesting chart and explanation:
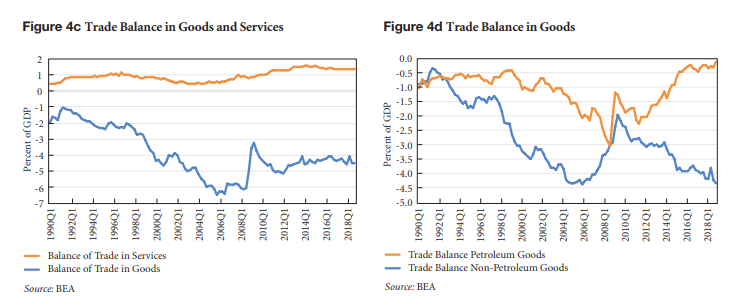
The main reason for the relative stability of the trade and current account balances is presented in Figure 4d. Since the beginning of the recovery, the trade deficit in goods except for petroleum products has been following its precrisis trend.3 At the end of 2018 it reached its precrisis peak—and for that matter its historical peak—of around 4.4 percent. However, at the same time this increase has been counteracted by the improvement in the trade balance of petroleum goods, related to shale gas extraction. The trade deficit of petroleum goods is now close to zero, compared to 2.2 percent of GDP when shale gas extraction started in 2011 and 3 percent before the crisis. It is not then hard to calculate that, had it not been for this improvement in the petroleum products trade balance, the overall trade deficit of the US economy would be close to 7 percent, or more.
…
Notes
…
- To be more precise, the trade balance of non-petroleum goods started slowly improving in 2006, more than a year before the economy officially entered the recession. This improvement had to do with two main factors: (1) the slowdown of the US economy that had started already in 2006, and (2) the significant depreciation of the dollar that started in 2002 and continued up until 2008.
