J. W. Mason And Alan Greenspan On Monetary Policy

J. W. Mason has a fantastic article titled The Fed Doesn’t Work For You in Jacobin: Reason In Revolt. I especially liked the lines where he points out economists’ inconsistency while worrying about rising wage share in the national income as coming from “demand” but explaining the fall in the share over the last 30-40 years as something “structural”.

There’s a funny disconnect in these conversations. A rising wage share supposedly indicates an overheating economy — a macroeconomic problem that requires a central bank response. But a falling wage share is the result of deep structural forces — unrelated to aggregate demand and certainly not something with which the central bank should be concerned.

Contrast that to Alan Greenspan who spoke recently after the Federal Reserve rate hike (h/t JKH):

A Conversation With Alan Greenspan

Greenspan talks of the money multiplier in response to a question by a lady about the Federal Reserve’s monetary policy after having conceded that he doesn’t understand how it works! To be more accurate he says that interest paid on reserves has helped in broad money not multiplying. But this explanation is as bad as the notion of the money multiplier.

The Phrase “Financial Intermediary” In National Accounts

A lot of times heterodox economists and bloggers complain about the usage of the phrase “financial intermediary” when talking about banks. Such as this one from 2016. The reason given is: “because loans make deposits”. In my opinion, this is counter-productive. While it’s true loans make deposits, it is irrelevant to whether banks should be termed financial intermediaries or not. In fact, that is standard usage. The System of National Accounts 2008, on para 4.101 says:

Financial corporations can be divided into three broad classes namely, financial intermediaries, financial auxiliaries and other financial corporations. Financial intermediaries are institutional units that incur liabilities on their own account for the purpose of acquiring financial assets by engaging in financial transactions on the market. They include insurance corporations and pension funds. Financial auxiliaries are institutional units principally engaged in serving financial markets, but do not take ownership of the financial assets and liabilities they handle. Other financial corporations are institutional units providing financial services, where most of their assets or liabilities are not available on open financial markets.

[italics and boldening in original]

Further 4.106 says:

In general, the following financial intermediaries are classified in this subsector:

a. Commercial banks, “universal” banks, “all-purpose” banks;

b. Savings banks (including trustee savings banks and savings and loan associations);

c. Post office giro institutions, post banks, giro banks;

d. Rural credit banks, agricultural credit banks;

e. cooperative credit banks, credit unions; and

f. Specialized banks or other financial corporations if they take deposits or issue close substitutes for deposits.

Heterodox economists use national accounts and flow of funds more often than orthodox economists who build their theory around a production function, so it is surprising that they vehemently oppose the usage of the phrase “intermediary” for banks. More importantly, the debate is not just semantics but also about “aggregate demand”. The ones who dislike the phrase “intermediary” seem to think that non-bank lending doesn’t have effects on aggregate demand. Funnily, while asserting others use the “loanble funds model”, they are themselves making such errors in their mental model.

Perhaps the term “financial intermediary” is used in the national accounts because it is centred around the production process. At the same time – of course – attention is equally given to finance. So there is nothing really to gain by trying to ban the usage of the phrase “intermediary” for banks.

Aside: IE users should upgrade their browser to IE11. 

Microsoft is going to stop support for old IE browsers. From now on, it will support the latest version only, unlike earlier when it was supporting several versions simultaeneously. So using old browsers will expose you to security risks. Websites’ codes are also browser dependent, so it is possible that my site won’t work with old IE soon. So please upgrade to IE11.

Or do something geeky. Pick up Chrome Canary or the Firefox Nightly build. But IE11 is not bad. It’s superfast.

Happy New Year!

Anwar Shaikh’s New Book

Anwar Shaikh is one of the few economists who had warned about cracks in the foundations of growth of the US economy and the world economy as a whole and that it will lead to a crisis in the 2000s. He has a new book titled Capitalism: Competition, Conflict, Crises. It will be published around February next year.

Capitalism - Competition, Conflict And Crises

The book and 1024 pages and looks like a huge analysis of all ideas in economics. You can preview the table of contents at amazon.com here. The book is published by Oxford University Press and the book’s page at OUP is here.

Anwar Shaikh is a very knowledgeable economist. In an interview to Ian Macfarlane, Wynne Godley says how much he learned about neoclassical economics from Anwar Shaikh. They then put up a paper titled An Important Inconsistency at the Heart of the Standard Macroeconomic Model. Wynne Godley considered it one of his most important papers. I like the paper and want to sometime rework it in a slightly different way to show that neoclassical economics makes no sense at all.

Anwar Shaikh

Anwar Shaikh, Levy Institute, May 2011, Photograph by me.

New Enhanced Financial Accounts In The Federal Reserve’s Flow Of Funds (Z.1) Report

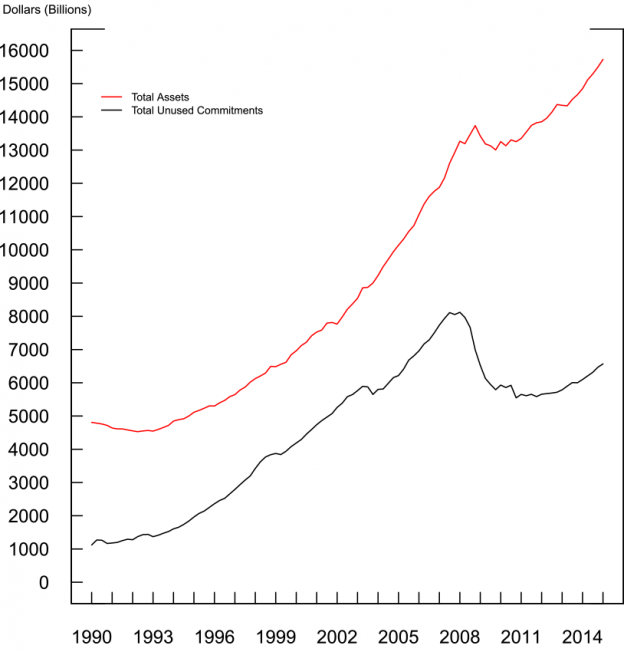
The Federal Reserve produces quarterly data for the financial accounts of the United States (earlier called “flow of funds”). There are a few notable additions termed enhanced financial accounts, which are in the process of being added. Some additions are details about money market mutual funds, off-balance sheet items of depository institutions, such as unused commitments, letters of credit and derivatives. This is the chart from the Federal Reserve’s FEDS note Off-Balance Sheet Items of Depository Institutions in the Enhanced Financial Accounts


meisenzahl-fig1-20150828-624x652This data is probably not new but has been added in the report. Indeed it was one of the important points of Basil Moore’s book Horizontalists and Verticalists.

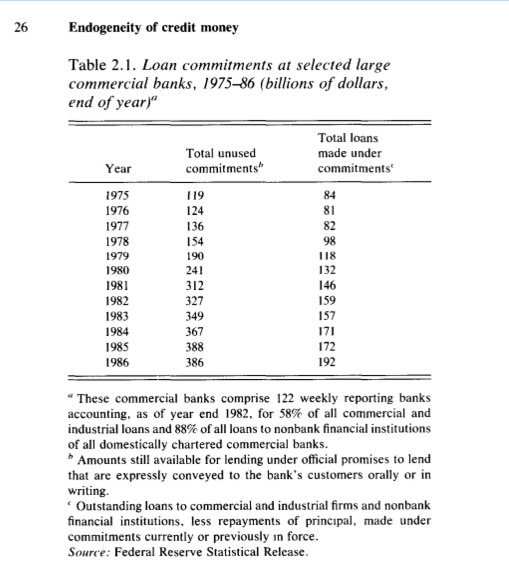
Basil Moore - Horizontalists And Verticalists - Loan Commitments

Moore has a sophisticated way of saying things (pages 24-25):

In making a loan commitment a bank should be viewed as a participant in forward rather than spot lending markets. Viewed as a seller of contingent claims, banks themselves obviously can excercise only limited control over the volume of their lending.

On page 186 of Moore’s book, he also notes that Keynes talks about this in his book A Treatise On Money:

Keynes insists that cash facilities of the public includes unused overdraft facilities, “of which we have no statistical record whatever” (JMK, 5, p. 37). He then concludes, “Thus the cash facilities, which are truly cash for the purposes of the theory of the value of money, by no means correspond to the bank deposits which are published” (JMK, 5, p. 38).

Tracking Keynes’ writing Moore concludes that although Keynes talked of unused overdraft facilities, he fails to recognize its importance in theory. Moore says (p. 203):

Keynes then returned to the issue of unused overdraft facilities, without, however, recognizing that this was the key to the endogeneity of the money stock:

[Keynes]: In Great Britain the banks pay great attention to the amount of their outstanding loans and deposits, but not to the amount of their customers’ overdraft faclities … it means that there is no effective pressure on the resources of the banking system until the finance is employed … there is no superimposed pressure resulting for planned activity over and above the pressure resulting from actual activity. (JMK, 14, pp. 222-23).

Honestly, I am not sure what Keynes is trying to say in all this. Moore is quite clear in his book. It’s still nice to know that Keynes discussed all this. Perhaps he wanted to say something more but couldn’t translate his thoughts in words. But if you can interpret Keynes, do tell me!

Krugman’s 45 Degree Rule

Recently, Paul Krugman reminded us of his “45 degree rule” on his blog Conscience Of A Liberal. This was a reference to his paper in 1989 which was a rediscovery of Thirlwall’s Law from 1979 [1] which states that the long run rate of growth of any country is constrained by the rate of growth of exports divided by the income elasticity of imports. Krugman rediscovered this law but interpreted the causality in the opposite way. This shouldn’t be surprising because in neoclassical economics, growth is explained by a production function and it is then difficult to interpret the causality in Thirlwall’s way. In an essay [2], John McCombie explains:

Krugman (1989) rediscovered Thirlwall’s Law, which he termed the 45-degree rule, as empirically ε/π = y/z or, when the (log) of the former is regressed on the (log) of the latter, the coefficient is unity or the slope of the line is 45-degrees. (Krugman provides some empirical evidence providing further confirmation of this empirical relationship). Like McCombie and Thirlwall (1994), he rules out sustained changes in the real exchange rate as a factor in bringing the balance of payments into equilibrium. Consequently, it is necessary to explain why the rule holds. The Keynesian explanation is that it is growth rates that adjust to maintain the balance of payments in equilibrium, but this is rejected by Krugman on “a priori grounds” that it is “fundamentally implausible.” He continues that “we all know that differences in growth rates among countries are primarily determined in the growth rates of total factor productivity, not differences in the rate of growth of employment; it is hard to see what channel links balance of payments due to unfavourable income elasticities to total factor productivity growth” (Krugman, 1989, p. 1037).

The Krugman article is instructive because it goes to the heart of the question about the direction of causation. Drawing on new trade theory, monopolistic competition, and the importance of increasing returns, he argues that faster growth leads to increased specialisation and the production of new goods for sale in overseas markets. Thus high “export elasticities of demand” are due to a dynamic supply side and rapid growth, rather than vice versa.

[x is the growth of the volume of exports, π is the domestic income elasticity of demand for imports, ε is the world income elasticity of demand for exports, and z is the growth of world income]

For a more forceful defence of Thirlwall’s Law, see McCombie’s paper.

In my opinion, the causality runs in both directions. However I am more sympathetic to Thirlwall and McCombie. And because the causality runs in both directions, there is still a balance-of-payments constraint. Complex economic dynamics still benefit richer nations and immiserate others. To an extent, this is already present in Kaldorian models. Growth brings in rise in productivity and this effects price competitiveness and hence beneficial to balance of payments generally. However, I also consider the income elasticity as being affected by growth at home and abroad.

References

  1. Thirlwall, A. P. (1979) ‘The Balance of Payments Constraint as an Explanation of International Growth Rate Differences’, Banca Nazionale del Lavoro Quarterly Review, March.
  2. McCombie, J.S.L. (2011) ‘Criticisms and defences of the balance-of-payments constrained growth model: some old, some new ‘, PSL Quarterly Review, vol. 64 n. 259 (2011), 353-392. (Can be previewed on Google Books here)

Few people are capable of expressing with equanimity opinions which differ from the prejudices of their social environment. Most people are even incapable of forming such opinions. — Albert Einstein, Essay to Leo Baeck (1953)

100 Years Of General Relativity

This month, a century ago, Albert Einstein wrote down the gravitational field equations. General Relativity is still the most beautiful theory discovered by the human intellect. There are two nice articles on this:

  1. The New York Times: A Century Ago, Einstein’s Theory of Relativity Changed Everything.
  2. The Economist: The most beautiful theory

The most fascinating result of General Relativity is that the universe is dynamic. Both articles give a brief history of what was on Einstein’s mind. When he found that his equations tell us that the universe is dynamic (i.e., either expanding or contracting), Einstein could not come to terms with it, initially. He then added a term to his field equations, perfectly allowed, to produce the result that the universe is static. This is called the cosmological constant term. However, Willem de Sitter came up with a solution for the field equations with this cosmological constant term, in which the universe is dynamic. This probably embarrassed Einstein, who later called it (adding the cosmological constant term) the greatest blunder of his life. However, physicists later concluded otherwise because there is no reason why this term shouldn’t be there. At any rate, Einstein’s General Relativity tells us that the universe is dynamic and only later did experiments verify this fact.

General Relativity also gives us a starting point – a scientific nature of inquiry – in asking about life, universe and everything.  In a film, A Brief History of Time, Roger Penrose says:

I think I would say that the universe has a purpose, it’s not somehow just there by chance … Some people, I think, take the view that the universe is just there and it runs along – it’s a bit like it just sort of computes, and we happen somehow by accident to find ourselves in this thing. But I don’t think that’s a very fruitful or helpful way of looking at the universe, I think that there is something much deeper about it.

Marc Lavoie On The New Fiscalism

Writing for the Broadbent Institute’s blog, Marc Lavoie argues that now that Conservatives are out of power in Canada, the Federal Balanced Budget Act passed in June 2015 should be repealed. According to the Act, pay of the Prime Minister and Ministers and Deputy Ministers have to be reduced by 5% if the federal government is in deficit outside a recession and frozen if the economy is in recession.

Marc Lavoie says:

The Federal Balanced Budget Act that was included in the omnibus Bill C-59, and which passed third reading in June 2015, does not seem to have attracted much engagement either. The Act does not force the federal government to adopt a balanced budget – it has some of the flexibility advocated by the PBO. But it includes measures that discourage the federal government from taking expansionary fiscal measures pre-emptively before a recession is declared. Furthermore, it will induce the federal government to attempt to minimize budget deficits during recessions and to quickly achieve a balanced budget or budget surpluses.

The article also coins the phrase new fiscalism (term originally by Mario Seccareccia):

counter-cyclical fiscal policy should only be used when things are really bad, in particular when monetary policy seems to be running out of ammunition; otherwise, governments should achieve balanced budgets or surpluses.

Marc Lavoie instead argues that the Canadian federal government should use the large borrowing powers to aim to achieve full employment.

The full article Wage Suppression And The Federal Balanced Budget Act is here.

Rules about fiscal policy always have some dubiousness about them. This can easily be seen in stock-flow consistent (SFC) models. Let government expenditure be denoted by G, the tax rate by θ, and households’ propensities to consume out of income and wealth by α1 and α2, respectively. Imagine two almost similar economies

Economy 1: High propensities to consume – i.e., high values for α1 and α2.

Economy 2: Low propensities to consume – i.e., low values for α1 and α2.

Also assume the government expenditure G, and the tax rate θ are the same for both the economies. The budget deficit depends (among other things such as firms’ behavior) on G, θ, α1 and α2. Economy 1 will have a lower budget deficit and higher output and employment than Economy 2. So in order for Economy 2 to have the same level of output and employment as Economy 1, the government of Economy 2 should have a more expansionary fiscal policy than Economy 2. What the fiscal rules do is to endogenize fiscal policy (the government G and the average tax rate θ) with respect to the budget deficit.  This is further deflationary for Economy 2. This implies that fiscal rules have no legitimacy. Even within an economy, (such as either Economy 1 or Economy 2), propensities to consume are changing with time.

Fiscal policy rules sometimes are slightly less strict and accept balancing current expenditures with taxes. Even this is dubious – expenditure on paying school teachers isn’t less important in any sense than building a school. Even more importantly, the budget deficit depends on the current account balance of payments and a nation with a higher current account deficit than a similar economy with no external trade will have a lower output and higher budget deficit for the same fiscal policy.

Budget rules are hence deflationary to output and are anti-full-employment.

I hope the new Canadian government follows Marc Lavoie’s advice.

United States’ Net Wealth, Part 2

This is a continuation of my previous post, United States’ Net Wealth. There I pointed out a new table which has been included in the Federal Reserve Statistical Release Z.1, Financial Accounts of the United States – Flow of Funds, Balance Sheets and Integrated Macroeconomic Accounts. This table in flow of funds report is B.1: Derivation of U.S. Net Wealth.

In the meanwhile, the Federal Reserve has released a note U.S. Net Wealth in the Financial Accounts of the United States which is worth your time.

In the note, the authors detail about the meaning of the measure of the “U.S. Net Wealth.” The definition is similar to the System of National Accounts 2008 (2008 SNA). The net worth of a nation is the sum of non-financial assets plus the net international investment position. The note says:

In estimating U.S. net wealth, we use direct measures of the value of households’, nonprofits’, noncorproate businesses’, and governments’ nonfinancial wealth. For corporate businesses, we use the market value of their outstanding equity shares to better capture the value of intangible assets, such as intellectual property. We then net out financial obligations between U.S. resident households, businesses, and government agencies and the rest of the world, because the concept of U.S. net wealth should exclude nonfinancial assets that are financed abroad rather than domestically, and include the value of nonfinancial wealth held by U.S. entities abroad. Taking all this together, we define net U.S wealth as the value of tangible assets controlled by households and nonprofits, noncorporate business, and government sectors of the U.S. economy, plus the market value of domestic nonfinancial and financial corporations, net of U.S. financial obligations to the rest of the world.

[emphasis, boldening: mine]

So what table B.1 does is that it uses non-financial assets for all sectors except when shares of companies are publicly traded.

There is however an issue here. Value of equities outstanding needn’t be a good measure. This is because firms issue both debt and equity. Imagine the case of a corporation which has a debt/equity mixture of 9:1.

Suppose the balance sheet is like this (in the SNA/IMA format):

Assets
Non-financial assets: $1 bn

Liabilities and Net Worth
Market value of bonds issued: $900 mn
Market value of equities issued: $90 mn
Net Worth: $10 mn

I am assuming that “non-financial assets” is the correct value of both tangibles and intangibles, which is $1bn here. But because of debt securities, the value of equities ($90 mn) is highly unlikely to touch $1bn. In other words, the total outstanding value of equities issued by the corporation is hardly a measure of non-financial assets in this case. Applying this idea further, it can be concluded that we need to keep track of the debt securities of the corporation as well. In summary, table B.1 needs to be updated conceptually.

United States’ Net Wealth

The latest release of the Federal Reserve Statistical Release Z.1, Financial Accounts of the United States – Flow of Funds, Balance Sheets and Integrated Macroeconomic Accounts or just “flow of funds” has a new table B.1: Derivation of U.S. Net Wealth.

According to the release:

A new table on the derivation of U.S. net wealth (table B.1) has been added to the summary section of the “Financial Accounts.” The calculation of U.S. net wealth includes the value of nonfinancial assets (real estate, equipment, intellectual property products, consumer durables, and inventories) held by households and nonprofit organizations and noncorporate businesses. For the federal government and state and local governments sectors, only structures, equipment, and intellectual property products are included; values for land and nonproduced nonfinancial assets are not available. The measure of U.S. net wealth also includes the market value of domestic nonfinancial and financial corporations, and is adjusted to reflect net U.S. financial claims on the rest of the world. This definition of U.S. net wealth differs from the sum of the net worth of sectors shown in the Integrated Macroeconomic Accounts (IMA). A forthcoming FEDS Note will provide additional information.
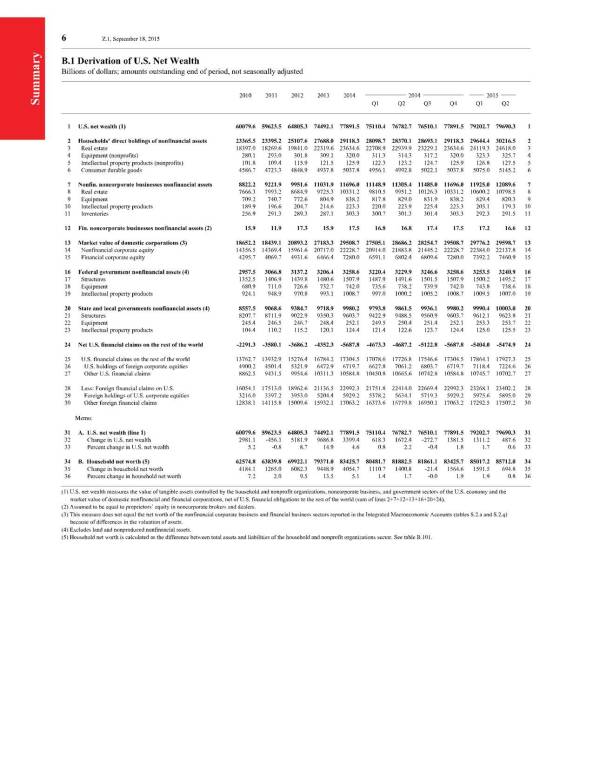
United States Net Worth

click to expand, and click again to zoom

According to it, the United States net wealth was $79.69 trillion.

It’s important to understand how this is reached. Normally we divide the world in various sectors: households, production firms, the financial sector, government and the rest of the world. In real life one adds more nuances to all this. So for example, in the table above, we have a sector “non-financial non-corporate businesses”.

Now, there are two types of assets: non-financial assets and financial assets. Non-financial assets are things such as houses, machines and so on. Financial assets are things such as currency notes, bonds, equity securities and so on.

In the system of national accounts (e.g., the 2008 SNA), all financial assets have a counterpart liability. So financial assets = liabilities for the world as a whole. It’s of course not true for a nation because assets and liabilities between residents and non-residents do not cancel out.

There is one complication, however: equity securities. The 2008 SNA treats equity securities as liabilities of corporations, just like debt securities. This is despite the fact that a company isn’t bound by law to pay dividends to holders of equity, unlike the case for debt securities or loans (for which interest is needed to be paid periodically and also the principal upon maturity).

All economic units have a net worth. This is the difference between assets and liabilities. So,

Assets = Liabilities + Net Worth.

Since equities are treated as liabilities in the 2008 SNA, the net worth of firms can in fact turn negative. This might happen if the price of equities is high.

So it is easy to derive the net worth of a nation. Resident economic units’ liabilities held by resident economic units cancel out and one is left with non-resident units’ liabilities to residents (i.e., resident units’ assets “held abroad”) and residents’ liabilities to non-residents.  This is the net international investment position.

So, as per the 2008 SNA (and the Balance of Payments Manual, 6th Edition),

Net Worth of a nation = Non-financial assets held by residents + Net International Investment Position

The Federal Reserve however does not do the same for flow of funds. It does not treat equities as liabilities.

But one has to be careful about double counting. It’s easy to sum up non-financial assets of all economic units, such as as done by the SNA. But in the flow of funds, with the special treatment on equities, we shouldn’t use corporate businesses’ non-financial assets. If you read the explanation and see the table B.1 carefully, corporate businesses’ assets have not been added, only “non-corporate businesses'” non-financial assets have been added. Since equities are not treated as liabilities in the sense of debt securities, the market value of corporations is needed to be added. This is line 13 in Table B.1.

There is one complication however. Even though equities is not treated as liabilities, that held by foreigners is treated as liabilities. Otherwise, one can have a source of inconsistency. Suppose equities held by a non-resident economic units is not treated as liabilities. Suppose foreigners sell $1bn of equities and purchase T-bills with that. This will mean that the net wealth reduces. Which doesn’t make sense. Hence, one is forced to treat foreigners’ equity holdings as liabilities. So the foreign aspect of the whole calculation is the same as as done in the SNA and one needs to include the net international investment position of the United States which is line 24. (minus $5.47 trillion).

So that basically summarizes the calculation of the United States net wealth as per the Federal Reserve flow of funds report.

How does this compare with the SNA measurement? Some tables in the report are only updated to 2014. So let’s use those numbers.

Flow of funds’ net wealth for 2014 = $77.89 tn (Table B.1, line 1).

Now, go to Table S.2.a. These tables use SNA definitions. Add lines 76-81.

This gives us a value of $87.34 trillion.

However the Z.1 report has an error in the way SNA/IMA way of calculating net worth. Line 77 in Table S.2.a is incorrect. There’s double counting. It uses the SNA/IMA concept of net worth but instead calculates it using the FoF concept. One should subtract line 29 in table B.101 which is $10.04 trillion. Hence the US net worth in the SNA definition is $87.34 trillion minus $10.04 trillion which is $77.30 trillion.

So in short, the net worth of the United States as per the flow of funds definition at the end of 2014 was $77.89 trillion and according to the SNA/IMA it was $77.30 trillion.

What does all this mean? Hmm. Not to easy to answer, except saying that familiarity with the system of measurement helps in understanding how the economy works. Which measurement is better – the new table B.1 or S.2.a? Doesn’t matter.

I am thankful to commenters in this blog post by Steve Randy Waldman, especially JKH and Marko.

Part 2 here United States’ Net Wealth, Part 2